If you're shopping for a financial advisor, you'll quickly find that fees vary a lot. But why do they vary? We analyzed fee schedules from 11,070 advisory firms filed with the SEC and plotted their fees against four firm characteristics: minimum investment, average client portfolio size, total firm assets, and assets per advisor.
The results challenge some common assumptions. One factor barely matters at all. Another predicts fees better than the rest.
1. Firms That Serve Wealthier Clients Charge Lower Percentages
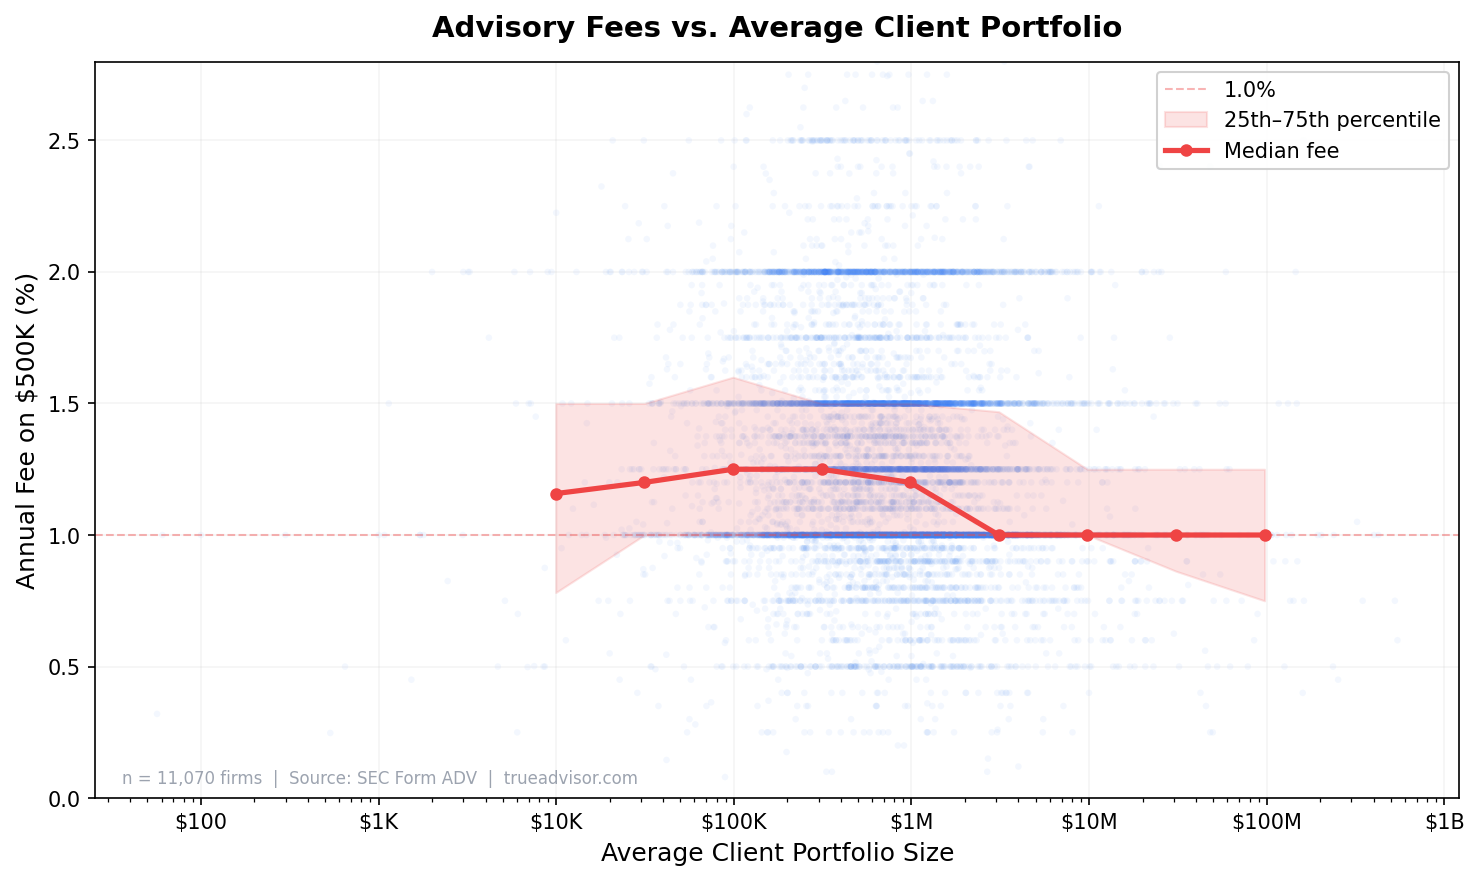
This was the strongest relationship we found. Firms whose typical client has a $50K–$200K portfolio charge a median fee of about 1.2% to 1.25% on a $500K account. Firms whose typical client has $1M+ charge closer to 1.0%.
This makes intuitive sense: advisory firms that serve larger accounts can afford to charge a lower percentage because the dollar amount is still substantial. A 1% fee on a $2M portfolio is $20,000—plenty to run a profitable practice. A 1% fee on $100K is only $1,000, which barely covers overhead.
The practical takeaway: if you're comparing two firms and one primarily works with clients much wealthier than you, their published fee schedule may look better on paper. But you may get more attention and service from a firm where your portfolio is closer to their average.
2. Higher Minimums Weakly Predict Lower Fees
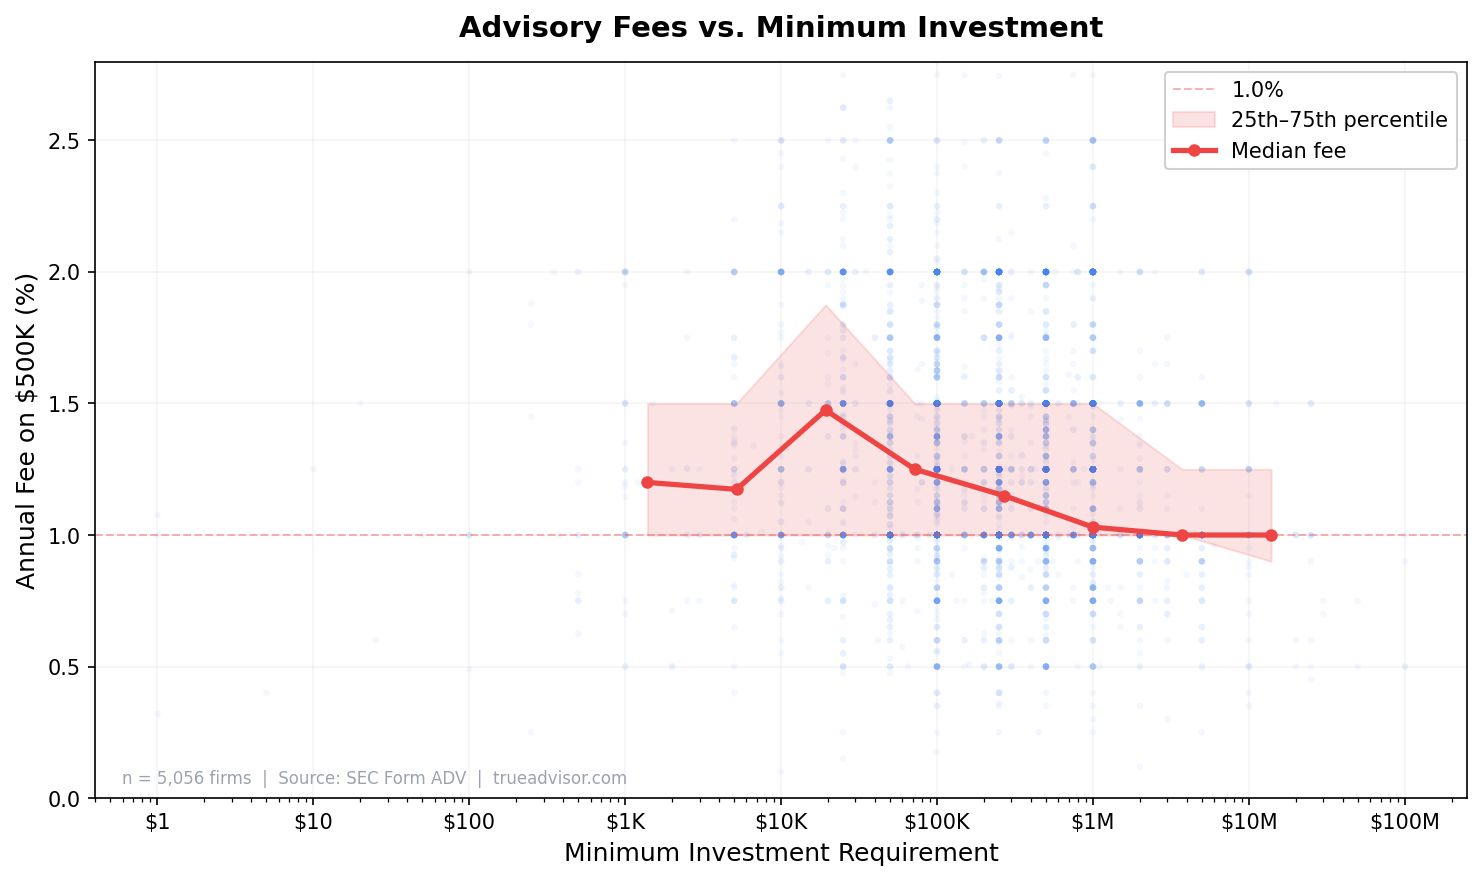
Firms with higher minimum investment requirements tend to charge slightly lower fees, but the relationship is weaker than you might expect. Median fees are about 1.15% at firms with a $1M+ minimum versus 1.2–1.45% at firms requiring $25K–$100K.
The relationship is noisy because minimum investment is a blunt instrument. Some firms set a low minimum to attract new clients but charge standard rates. Others set a high minimum simply because they're at capacity, not because they're offering a volume discount.
Only about 5,000 of our 11,000 firms reported a minimum investment, so this data is also less complete than the other comparisons.
3. Firm Size (Total AUM) Has Almost No Effect on Fees
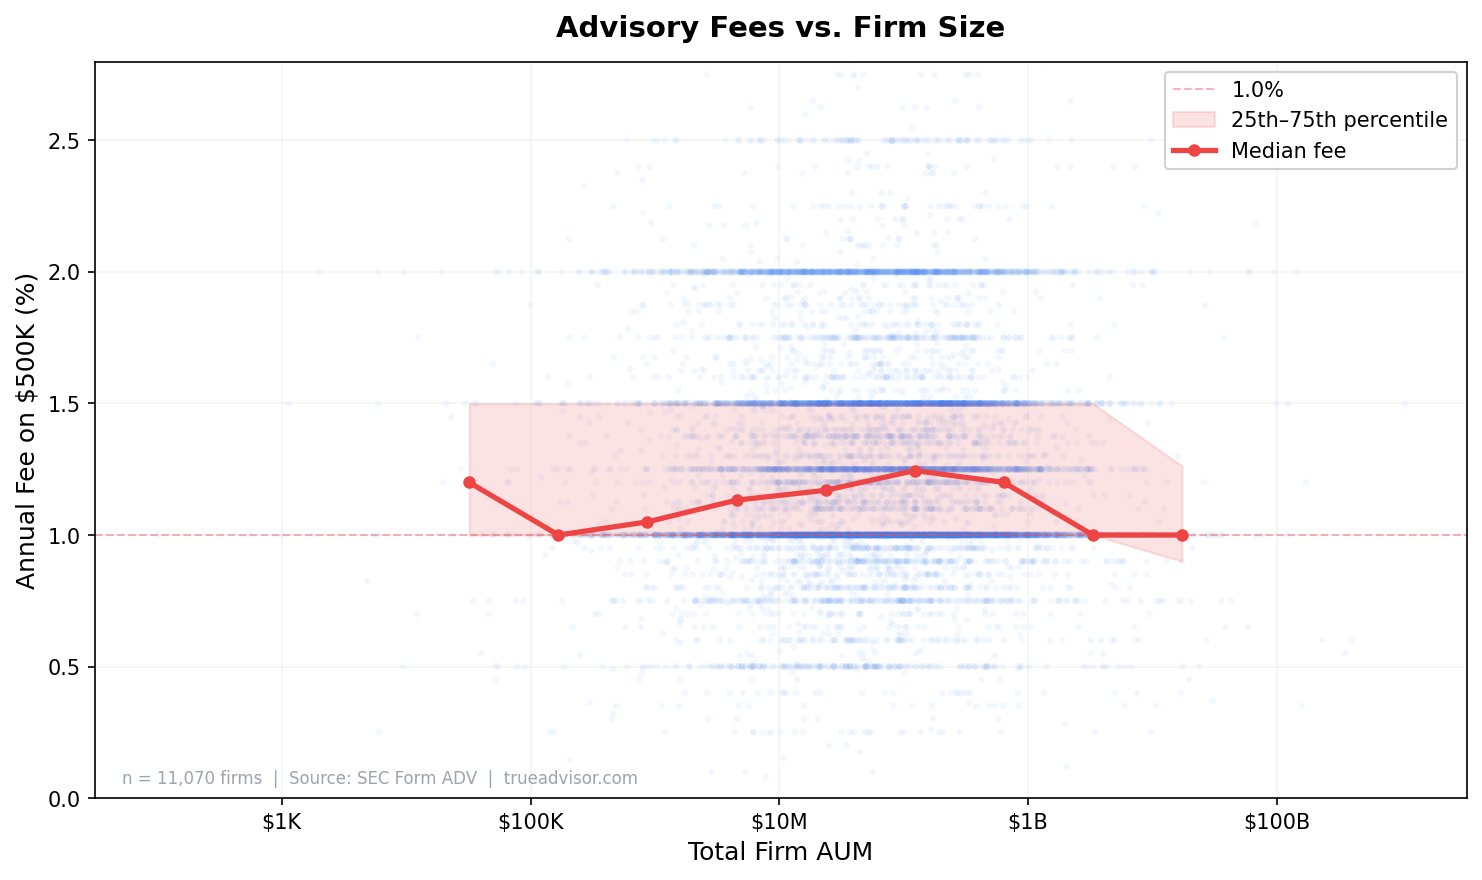
This was the most surprising finding. Whether a firm manages $10 million or $10 billion, the median fee on a $500K portfolio is essentially the same: around 1.1–1.2%. The statistical correlation was effectively zero (Spearman r = 0.01, not statistically significant).
This challenges the assumption that big firms offer economies of scale that get passed on to clients. They don't—at least not in the form of lower percentage fees. Large firms may offer more services, better technology, or more specialized advisors, but they don't charge less.
It also means you shouldn't assume a small firm will be more expensive. Boutique practices compete on price just as effectively as large enterprises.
4. Assets per Advisor: A Weak Signal
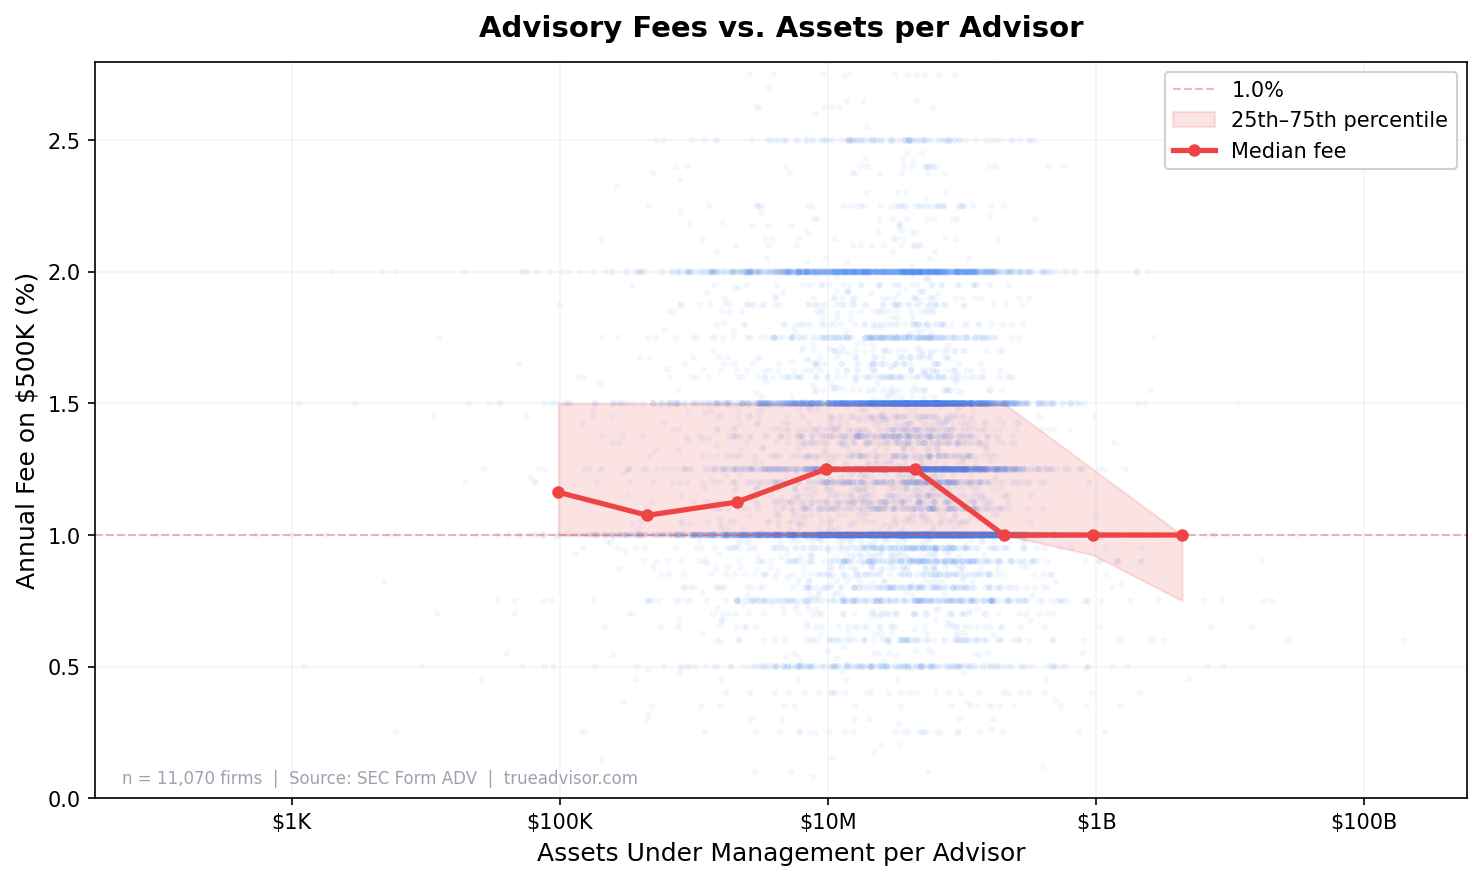
Advisors who manage more assets per person tend to charge slightly lower fees, but the effect is modest. The median drops from about 1.2% for advisors managing $10M–$50M each to about 1.0% for those managing $500M+ each.
This is partly a proxy for client wealth. An advisor managing $500M across 50 clients (averaging $10M each) is in a different business than one managing $20M across 200 clients ($100K each). The former can afford a lower rate because each client relationship is highly profitable.
The Rankings
| Factor | Correlation | Verdict |
|---|---|---|
| Avg. client portfolio | r = −0.15 | Strongest predictor. Wealthier clientele → lower fees. |
| Minimum investment | r = −0.14 | Moderate. Higher minimums often mean slightly lower fees. |
| Assets per advisor | r = −0.07 | Weak. Slightly lower fees at higher scale. |
| Firm size (AUM) | r = 0.01 | No effect. Big firms don't charge less. |
All four correlations are weak in absolute terms. The strongest (average client portfolio) explains only about 2% of the variation in fees. The other 98% is driven by factors we can't see in the SEC data: the range of services offered, geographic market, the firm's pricing philosophy, and frankly, how much they think they can get away with.
What This Means for You
Don't assume a bigger or more exclusive firm will save you money. The data doesn't support it. A $50 billion firm and a two-person shop charge roughly the same percentage on a $500K portfolio.
Look at the actual fee schedule, not proxies. Minimum investment, firm size, and brand recognition are poor predictors of what you'll pay. The only reliable way to compare is to get the dollar amount for your specific portfolio size.
If you want lower fees, look at firms that serve clients similar to you—or slightly above you. The strongest predictor of fee level is who else the firm serves. If their average client has $5M and you have $500K, you're a small account to them and may not get the attention you deserve. But you'll probably get a decent rate.
Data source: Fee schedules extracted from Form ADV Part 2A brochures filed with the SEC. We parsed tiered fee tables from 11,070 advisory firms and calculated the actual percentage cost at a $500,000 portfolio size. Correlations are Spearman rank coefficients, which measure monotonic relationships on log-scaled data.